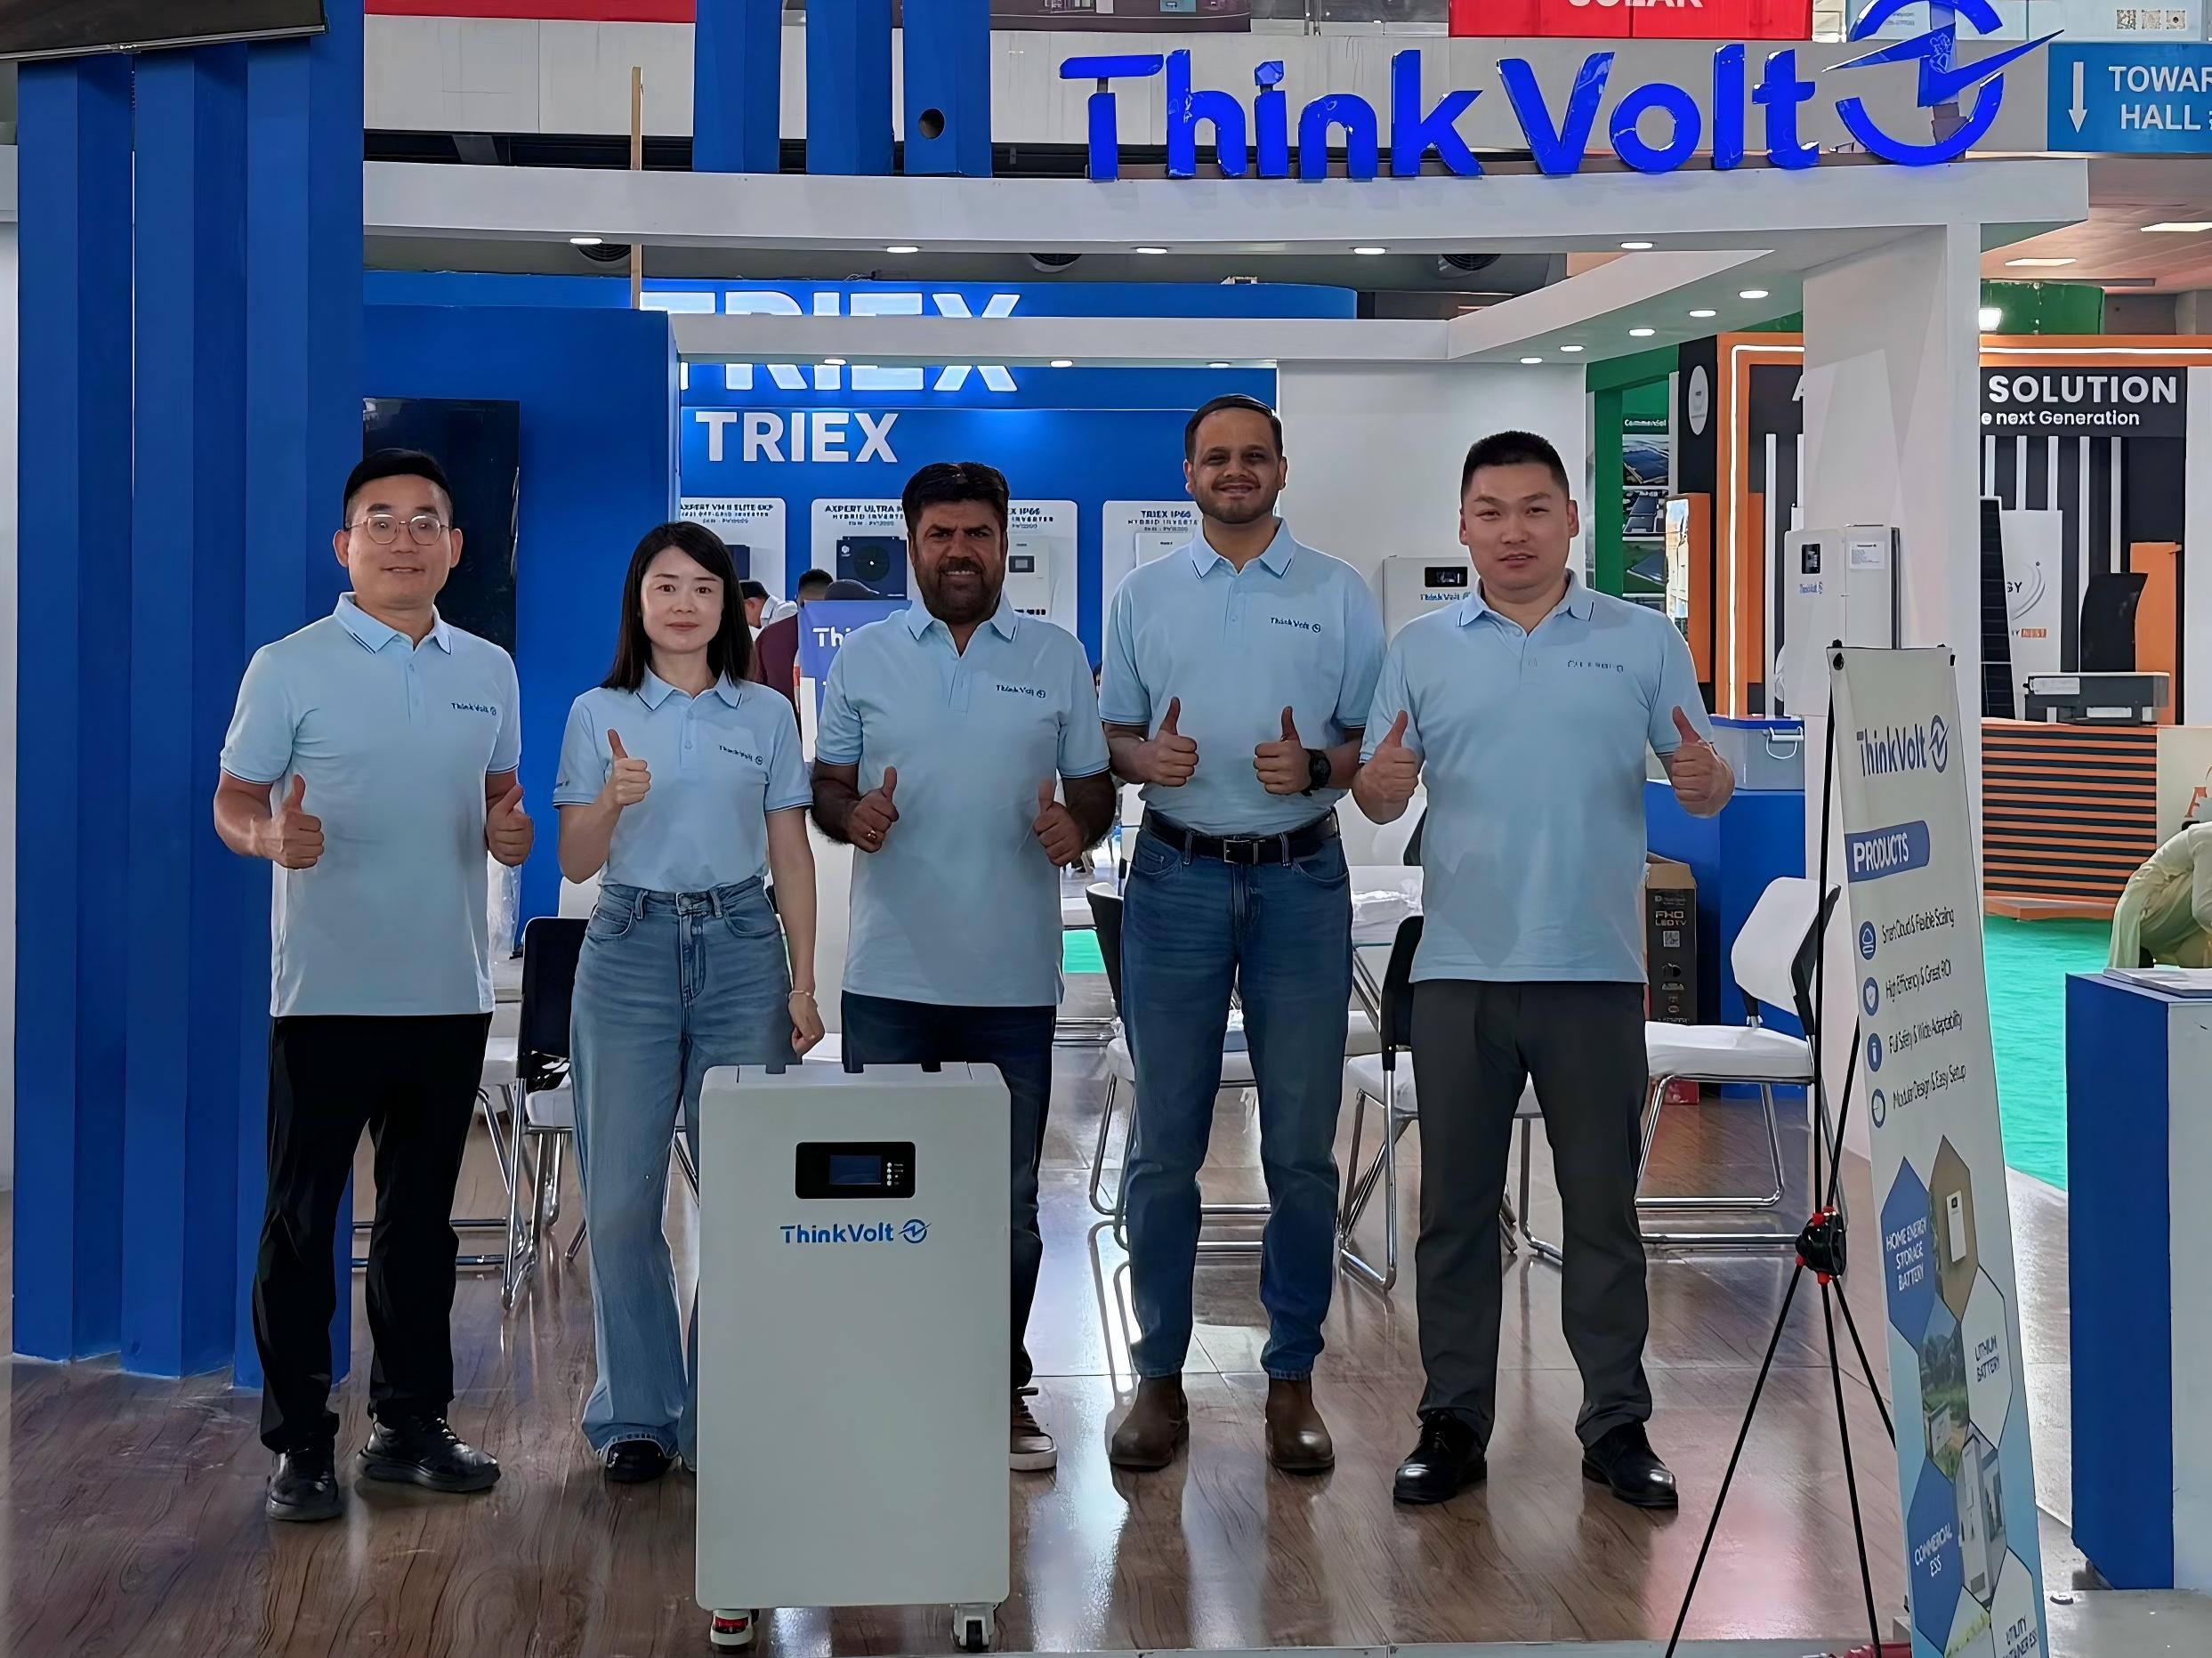
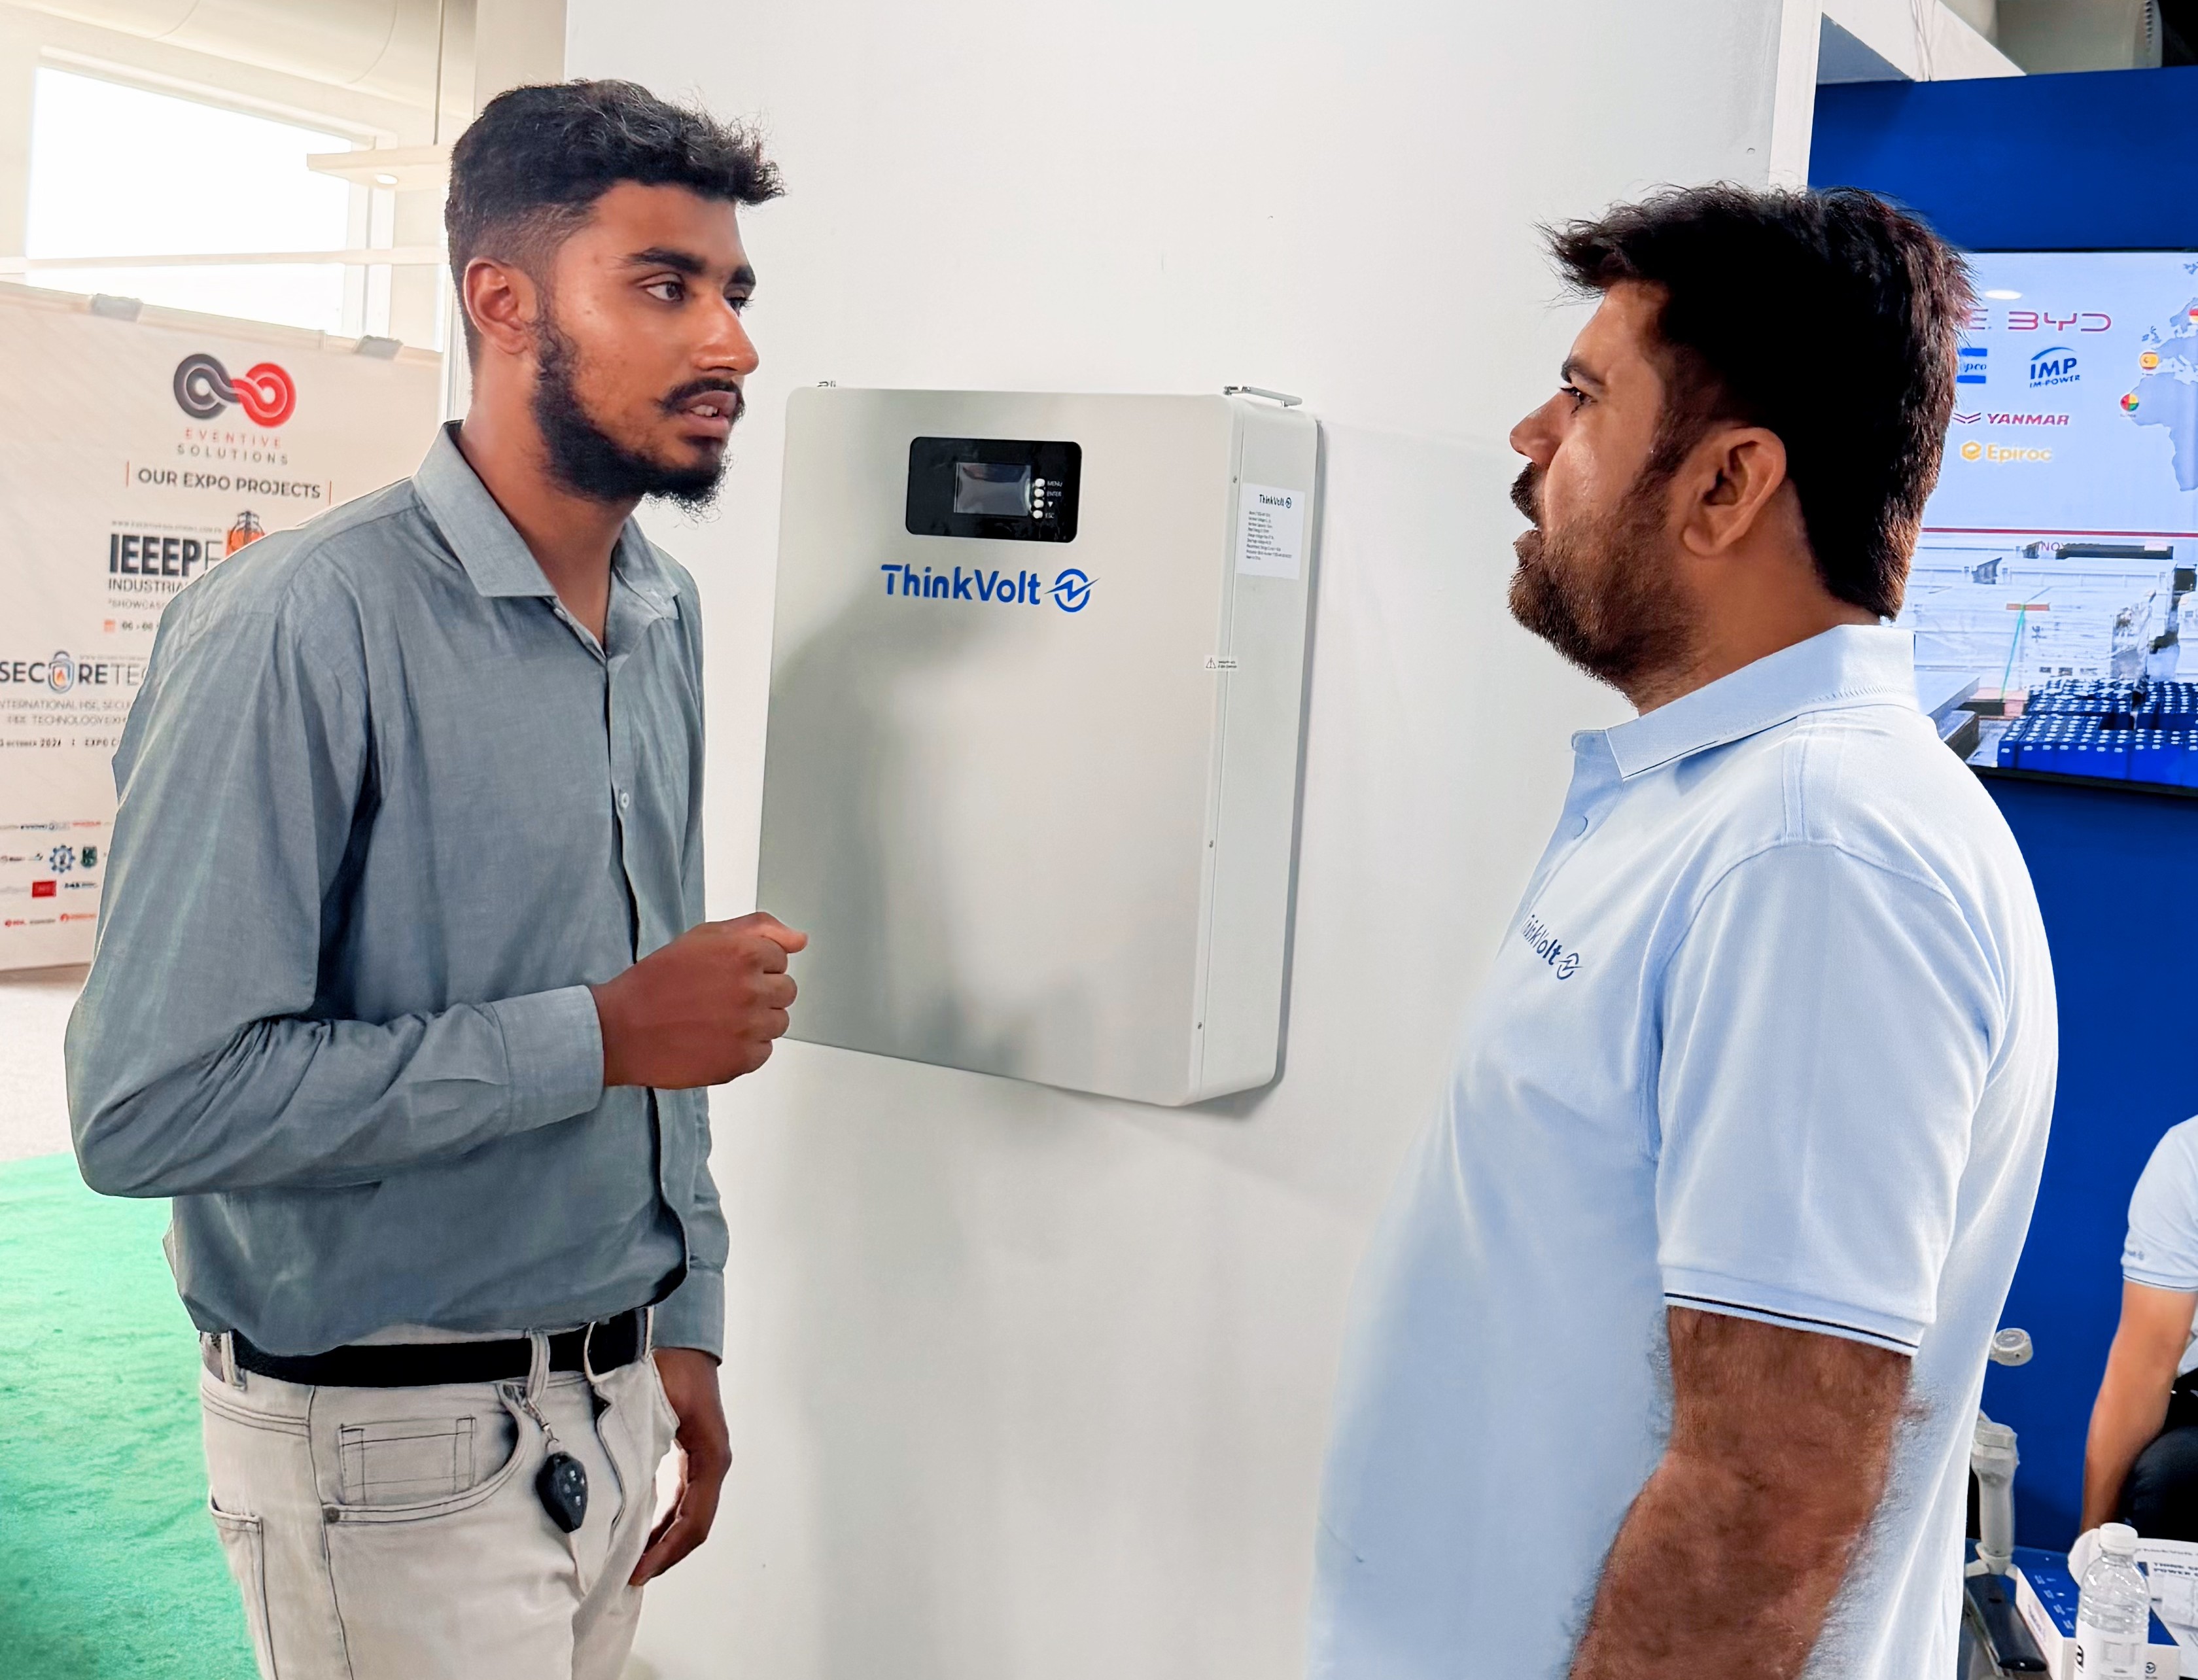
ThinkVolt at Solar & Storage Expo Pakistan 2026: Connecting with Pakistan’s Energy Storage Market
2026-07-23
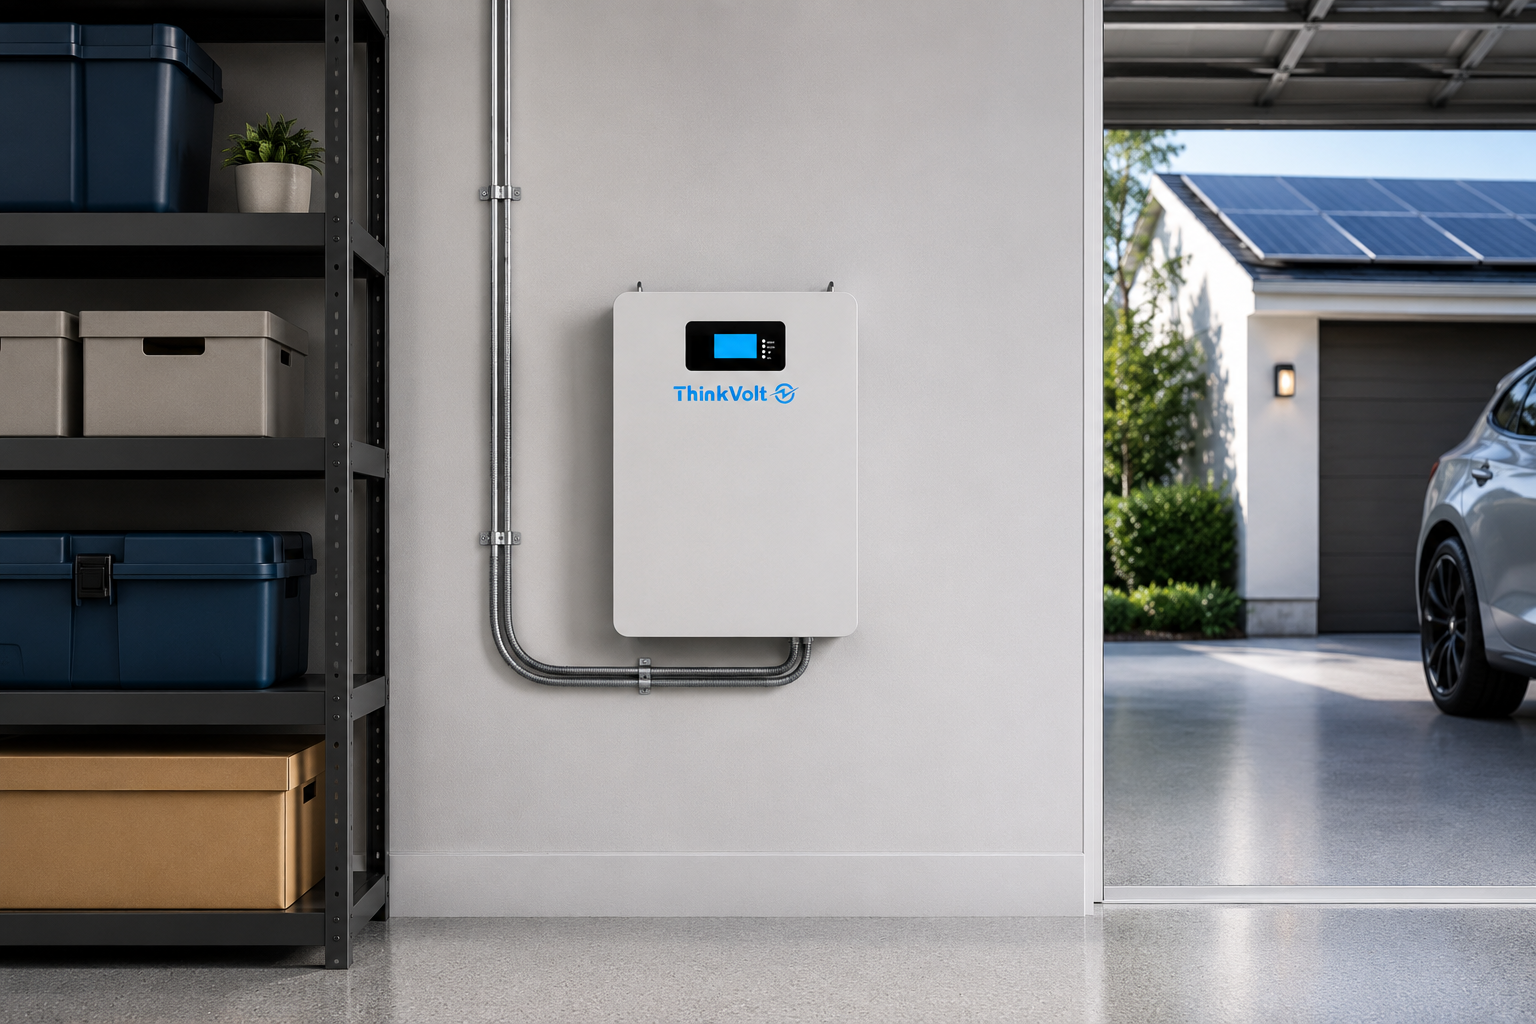
A home battery can still use power on standby, but there is no single standby wattage that applies to every system. Consumption depends on what remains active—such as the BMS, inverter, monitoring, and communications—and whether the system is in standby, idle, or sleep mode.
To estimate the energy loss, multiply the standby power in watts by the hours spent in that state, then divide by 1,000 to convert the result to kWh.
Standby consumption varies significantly between home battery systems, so the most useful figure is one measured for your specific system under a defined operating condition.
For context, HTW Berlin’s 2024 Energy Storage Inspection evaluated 20 lithium battery storage systems. Standby consumption with a discharged battery averaged about 13 W, while the lowest measured value was 2 W. The test also notes that these figures exclude BMS consumption.
These results are useful benchmarks, not a universal “normal range.” Before comparing any standby wattage, check what equipment and operating state the figure represents.
Standby generally means the battery system is not actively charging or supplying a significant load, although internal electronics may remain powered.
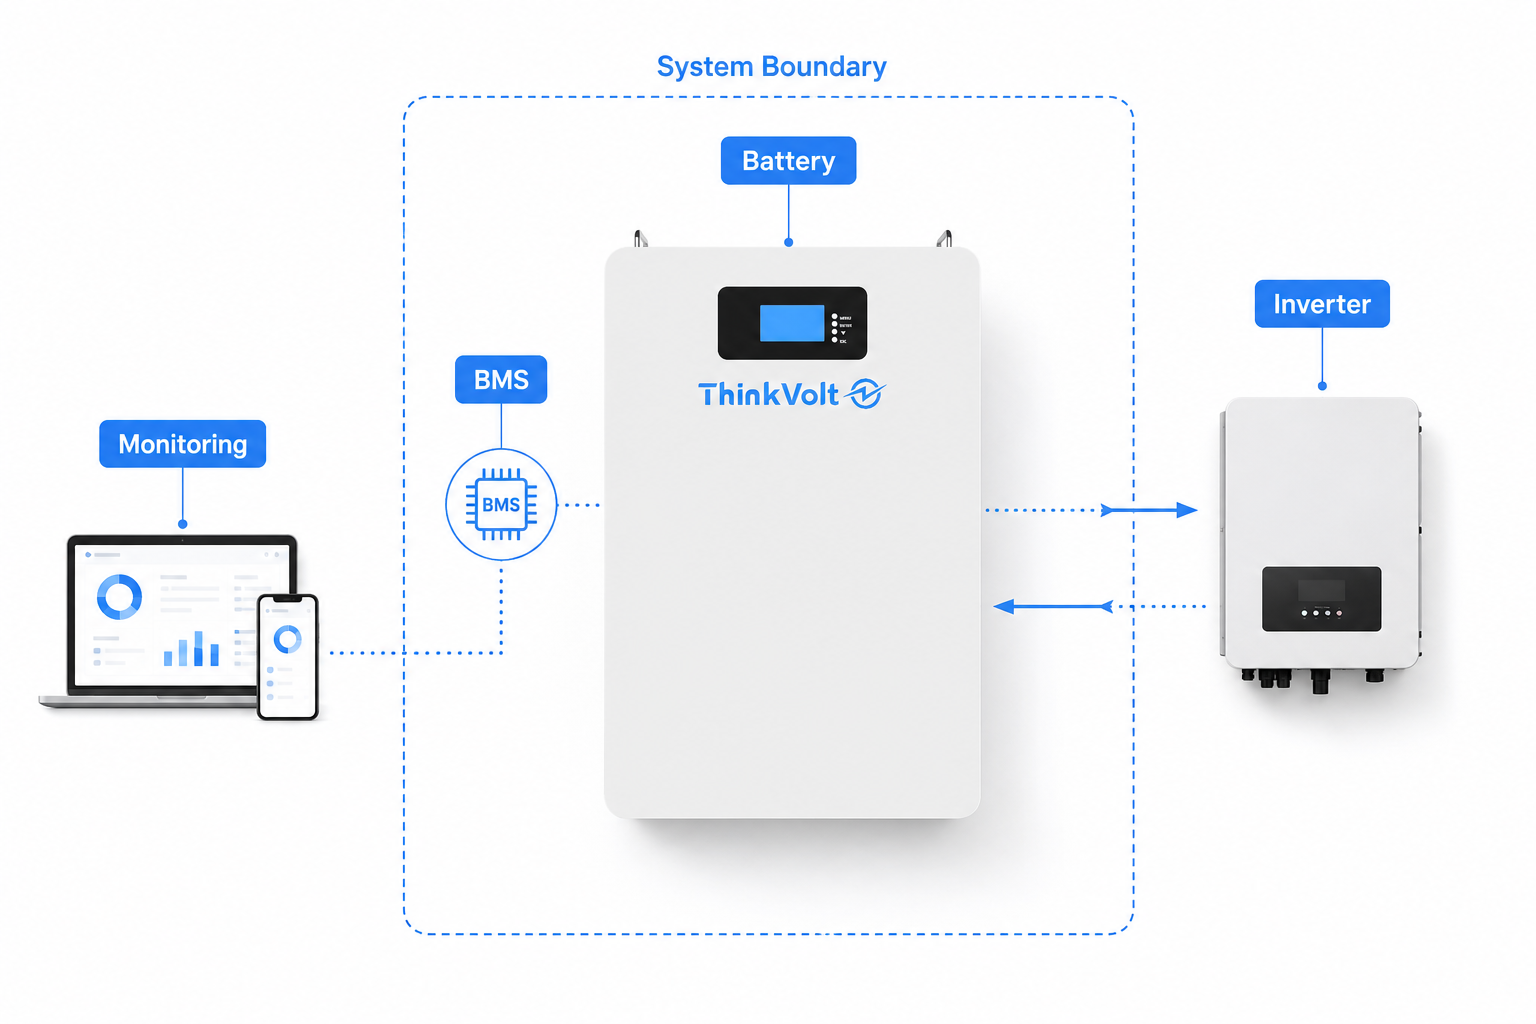
The measurement boundary matters. A figure may represent only the battery and BMS, while another may include an inverter or other system electronics. A standalone battery and an all-in-one energy storage system therefore may not be directly comparable.
Battery standby and inverter idle consumption are not necessarily the same. The battery may use power for management and communication, while an inverter can consume additional energy by remaining ready to respond.
Likewise, standby, idle, and sleep can describe different states. Always check which mode was measured before comparing specifications.
Use this formula:
Standby energy (kWh) = Standby power (W) × Standby hours (h) ÷ 1000
For example, if a system draws 10 W for 8 hours:
10 W × 8 h ÷ 1,000 = 0.08 kWh
The important point is to use the actual time spent in that state. A home battery may move between charging, discharging, idle, standby, and sleep during the same day.
Multiply the standby wattage by the actual standby hours per day and divide by 1,000.
Once you have a representative daily value:
Monthly standby energy = Daily standby energy × Number of days
Annual standby energy = Daily standby energy × 365
Do not automatically use 8,760 hours per year unless the same standby draw genuinely continues 24/7.
Even a small continuous load adds up over time. The table below assumes the stated power draw continues 24 hours a day.
Standby Power | 24 Hours | 30 Days | 365 Days |
2 W | 0.048 kWh | 1.44 kWh | 17.52 kWh |
5 W | 0.120 kWh | 3.60 kWh | 43.80 kWh |
10 W | 0.240 kWh | 7.20 kWh | 87.60 kWh |
20 W | 0.480 kWh | 14.40 kWh | 175.20 kWh |
These are calculation examples, not specifications for particular batteries. If your system spends only part of the day at the stated wattage, use those actual hours instead.
Start with the manufacturer’s datasheet or manual. Look for terms such as standby power, idle consumption, self-consumption, no-load consumption, or auxiliary power.
Before using the figure, confirm:
· what equipment the measurement includes;
· the operating mode and SOC;
· whether the inverter is included;
· whether communications and monitoring are active;
· whether the value is typical or maximum.
If these conditions are unclear, ask the supplier rather than assuming two specifications are comparable.
When checking actual consumption, keep the system boundary, SOC, and operating mode consistent. Allow enough time for the system to enter its intended standby or sleep state and observe the draw over a representative period.
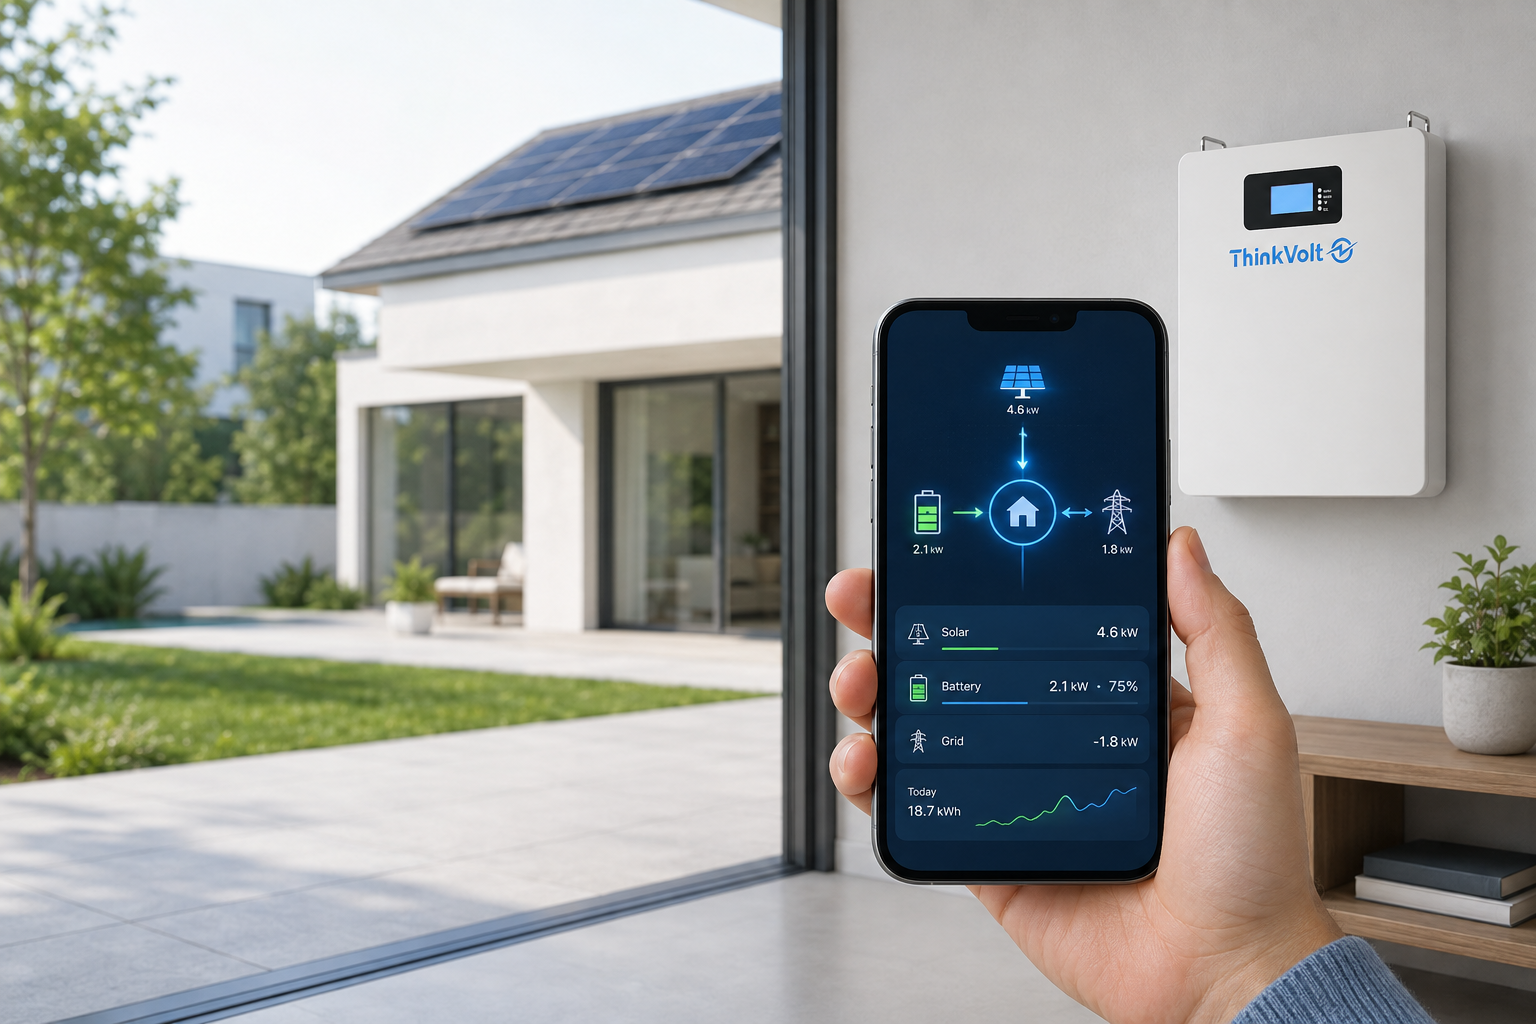
System monitoring can be useful, but confirm whether it reports battery-side power, AC-side power, grid exchange, or another value. Whole-home grid import should not automatically be treated as battery standby consumption.
Hardware-level electrical measurements should follow the manufacturer’s instructions and be performed by a qualified installer or technician where required.
Standby consumption varies because systems use different BMS designs, inverters, control electronics, communications, monitoring, firmware, and low-power strategies.
Yes. A BMS requires energy for monitoring, protection, control, and communication. An inverter or power conversion system may add further consumption when it remains ready to charge or discharge.
Independent testing of 26 residential PV-battery systems also found that some systems did not enter their lowest-power state immediately. In one example, consumption fell from 11 W to 3 W after discharge stopped and then reached 2 W about six minutes later.
This shows why a brief idle reading may differ from the system’s eventual sleep or standby consumption.
They can. Communication modules, remote monitoring, displays, energy management controls, and related electronics may remain active.
SOC, firmware, system configuration, and thermal-management activity can also affect auxiliary demand. Battery capacity alone therefore does not determine standby consumption.
There is no universal wattage that makes standby consumption “too high.” Instead, judge the figure by its measurement conditions and actual energy impact.
Use four checks:
1. Verify the system boundary. Is it battery-only or whole-system consumption?
2. Check the operating state. Compare standby with standby, not idle with deep sleep.
3. Calculate annual kWh. Use realistic hours in that state.
4. Compare like for like. Use similar SOC, operating modes, and measurement boundaries.
Independent laboratory testing of 26 residential PV-battery systems found discharged-state standby consumption ranging from about 2 W to 71 W, with a median of 12 W and a mean of about 18 W.
This wide spread demonstrates why independent test data is better used as a benchmark than as a pass/fail standard. An unexpectedly high result should prompt investigation of the system mode and auxiliary loads.
Convert standby power into annual kWh before evaluating its financial impact.
Annual standby cost = Annual standby energy (kWh) × Local electricity tariff
For example, a continuous 10 W load equals 87.6 kWh per year. Multiply that by your local electricity rate to estimate the annual cost.
Also consider where the standby energy comes from. Depending on the system, auxiliary loads may be supplied by stored battery energy, the grid, or available solar generation. During backup operation, auxiliary energy drawn from the battery leaves less stored energy available for household loads.
Standby consumption is also different from round-trip efficiency. Round-trip efficiency compares energy put into a storage system with energy recovered later under defined conditions, while standby consumption represents ongoing auxiliary demand in a specified low-activity state.
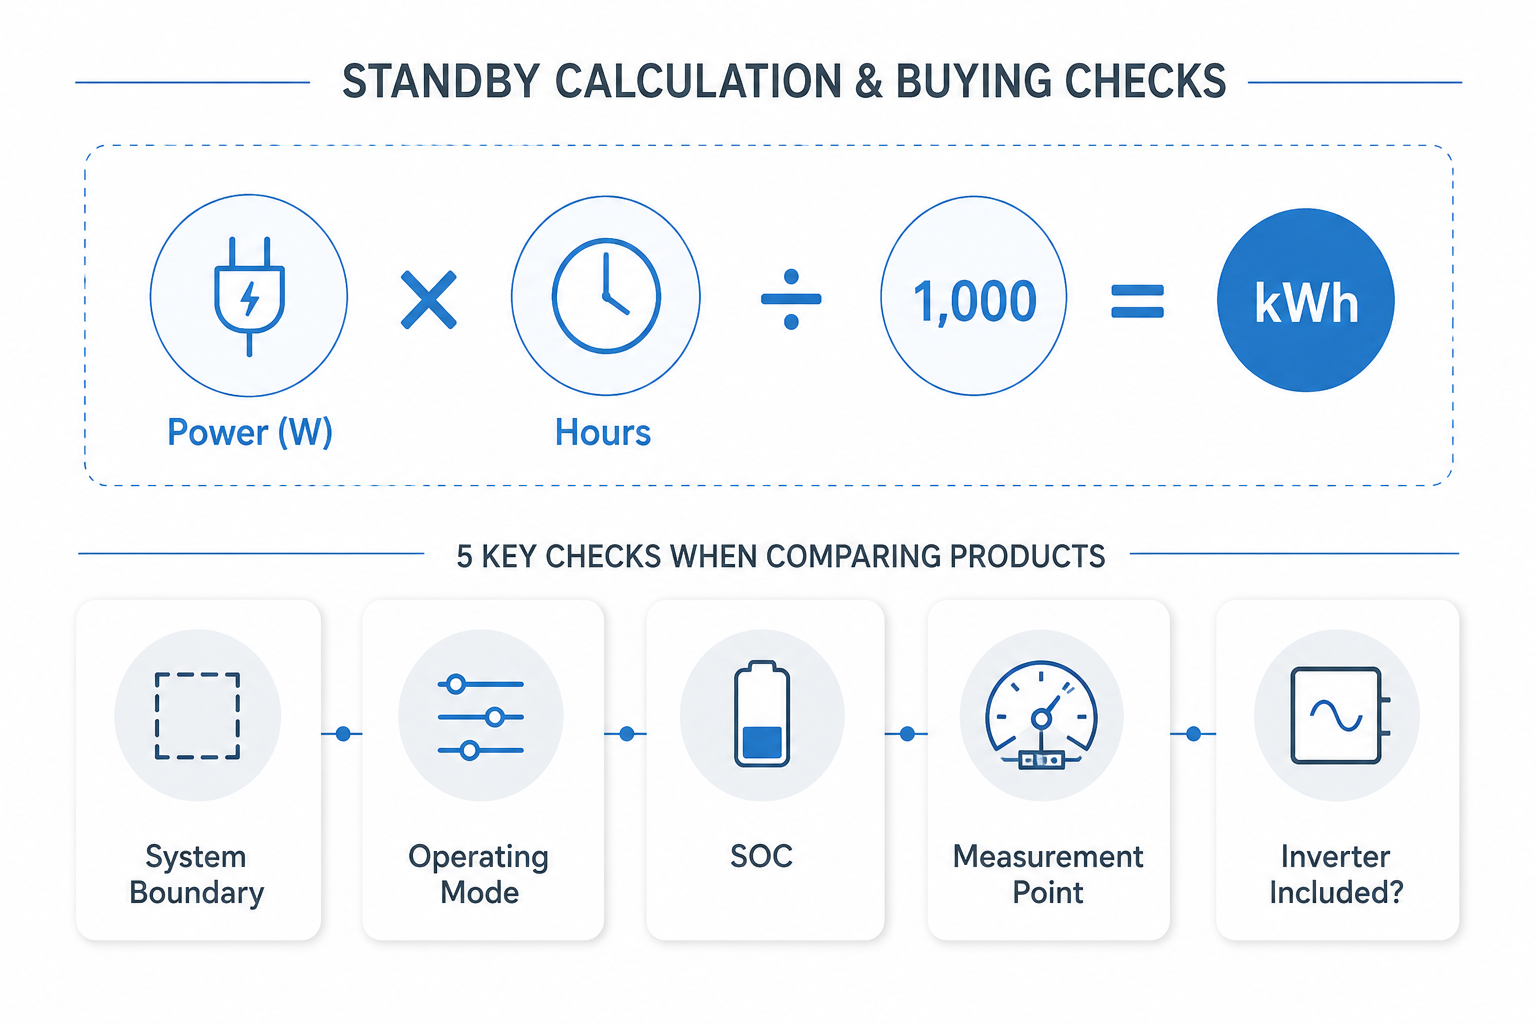
A lower published standby wattage does not automatically mean a better system. First make sure competing figures describe equivalent equipment and test conditions.
Ask the battery supplier or installer:
· What equipment does the figure include?
· Is the inverter included?
· At what SOC was it measured?
· Was the system in idle, standby, or sleep?
· Were monitoring and communications active?
· Was power measured on the AC side, DC side, or across the complete system?
· How long does the system take to reach its lowest-power state?
· Is the value typical, maximum, or independently measured?
Then consider standby consumption alongside usable energy, conversion efficiency, backup requirements, inverter compatibility, and operating strategy.
The goal is not simply to choose the lowest published wattage. It is to understand how much energy the complete system consumes while remaining ready for your application.
Most errors come from comparing the wrong loads or operating states.
Common Mistake | Why It Matters |
Standby consumption = battery self-discharge | Standby powers electronics; self-discharge is stored energy gradually lost within the battery. |
Battery standby = inverter idle consumption | The measurements may include different equipment. |
Standby loss = round-trip efficiency loss | They describe different types of system loss. |
Battery self-consumption = solar self-consumption | Solar self-consumption normally refers to using your own PV generation. |
Datasheet standby W applies 24/7 | The system may move through several operating states each day. |
Grid import = battery standby load | Other household loads may be consuming electricity. |
Before calculating, confirm what is being measured, which operating state applies, and how long that state lasts.
Not necessarily. Capacity alone does not determine standby consumption because much of the load comes from the BMS, inverter, communications, and other electronics. Compare the actual system architecture and operating conditions instead of assuming a larger battery must consume more.
It can in either condition. Control, monitoring, communication, and power-conversion functions may remain active, although some systems eventually enter a lower-power mode. The actual consumption and energy source depend on the system design and operating logic.
Do not switch off a battery solely to eliminate a small standby load without checking the manufacturer’s instructions. Powering down may affect backup readiness, monitoring, communications, or battery-management functions. Investigate unexpectedly high consumption before changing normal operating settings.
Yes, if auxiliary loads are supplied from stored battery energy during backup operation. They then become part of the total energy budget, leaving less energy for household loads. The effect depends on the auxiliary wattage, available stored energy, and required backup duration.
Neither replaces the other. Standby consumption describes auxiliary demand during low-activity periods, while round-trip efficiency measures energy losses through the storage and recovery process. Both should be considered alongside usable energy and the system’s real operating profile.
Ask what equipment is included, the operating mode and SOC, whether the inverter and communications were active, where power was measured, and whether the value is typical or maximum. Also ask how long the system takes to enter the stated low-power mode.
Home battery standby power is best evaluated by defining the operating state, converting the actual power draw into kWh, and comparing systems under equivalent conditions—not by judging one wattage in isolation.
If you are evaluating a residential energy storage project, share your required battery capacity, inverter model, backup time, installation conditions, and target quantity with ThinkVolt so the relevant system configuration and technical requirements can be reviewed.